We can use the GDP CAGR analysis to find the historical annual growth rates in GDP of the top 6 economies of the world.
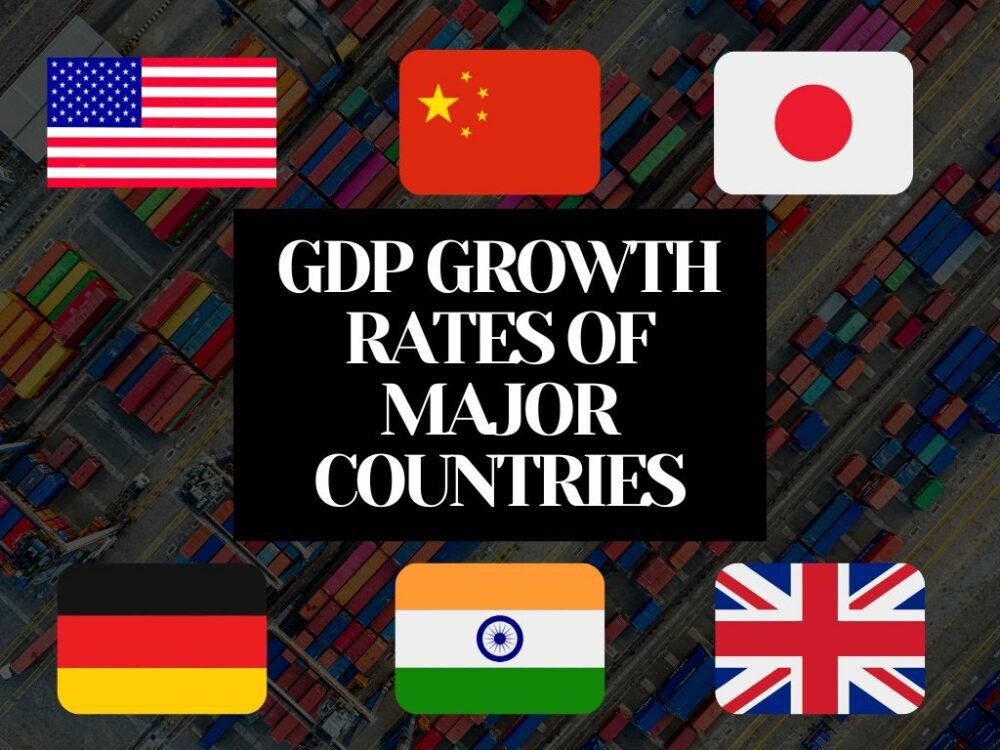
According to IMF, the 6 major economies in June 2023 (by their GDP) are the following countries, in order:
- United States: $ 26.85 Trillion
- China: $19.37 Trillion
- Japan: $4.41 Trillion
- Germany: $4.31 Trillion
- India: $3.74 Trillion
- United Kingdom: $3.16 Trillion
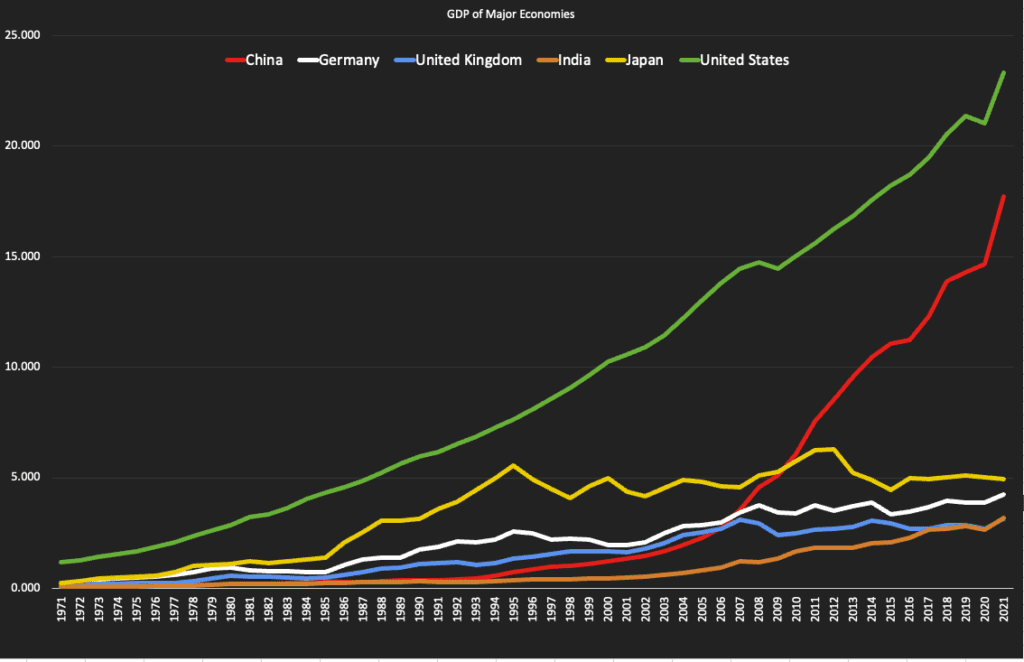
GDP growth of 6 major economies from 1971-2021 [World Bank]
1. USA GDP CAGR: Historical Growth Rate of USA’s GDP
- GDP in 1971: 1.165 Trillion USD
- GDP in 2021: 23.315 Trillion USD
- Years: 1971-2021 (50 years)
We can use the CAGR Calculator to determine the GDP CAGR of the United States for 50 years (1971-2021).
- Initial Value: 1.165
- Final Value: 23.315
- Time: 50
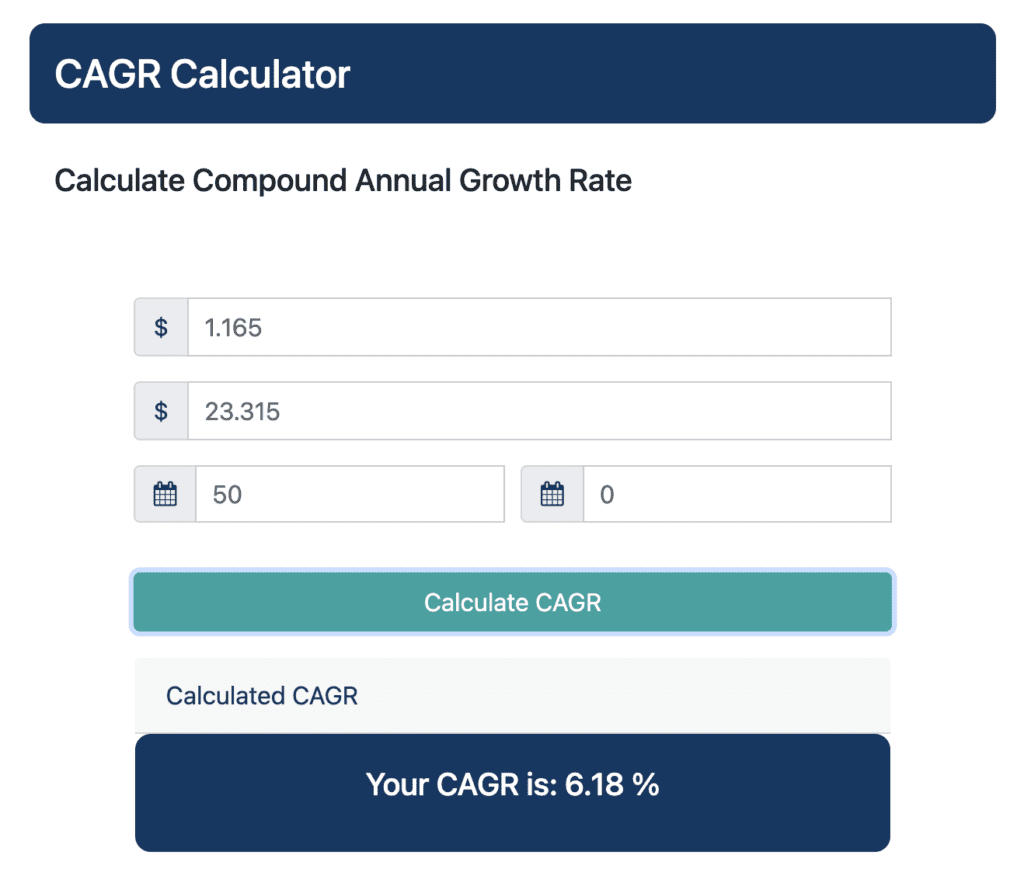
We observe the average historical GDP growth rate of the United States is 6.18% per year between 1971 and 2021.
2. China GDP CAGR: Historical Growth Rate of China’s GDP
- GDP in 1971: 0.100 Trillion USD
- GDP in 2021: 17.734 Trillion USD
- Years: 1971-2021 (50 years)
We can use the CAGR Calculator to determine the GDP CAGR of China for 50 years (1971-2021).
- Initial Value: 0.100
- Final Value: 17.734
- Time: 50
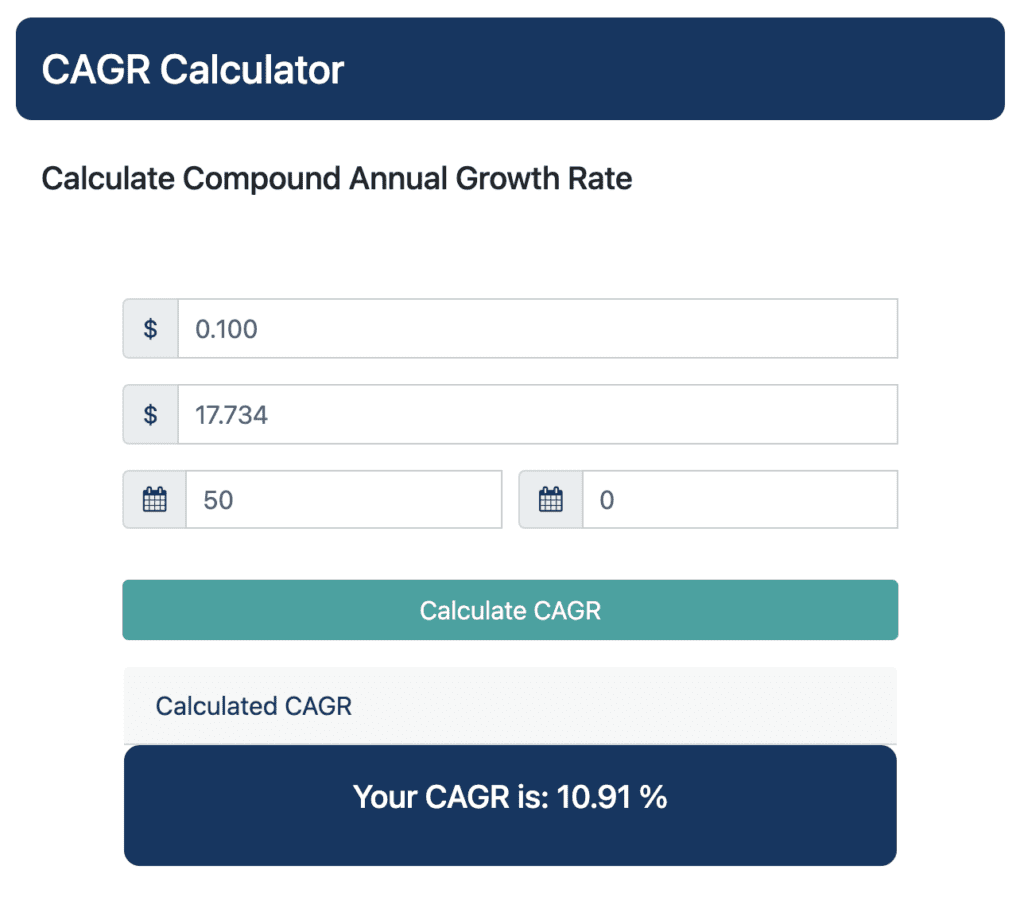
We observe the average historical GDP growth rate of China is 10.91% per year between 1971 and 2021.
3. Japan GDP CAGR: Historical Growth Rate of Japan’s GDP
- GDP in 1971: 0.240 Trillion USD
- GDP in 2021: 4.941 Trillion USD
- Years: 1971-2021 (50 years)
We can use the CAGR Calculator to determine the GDP CAGR of Japan for 50 years (1971-2021).
- Initial Value: 0.240
- Final Value: 4.941
- Time: 50
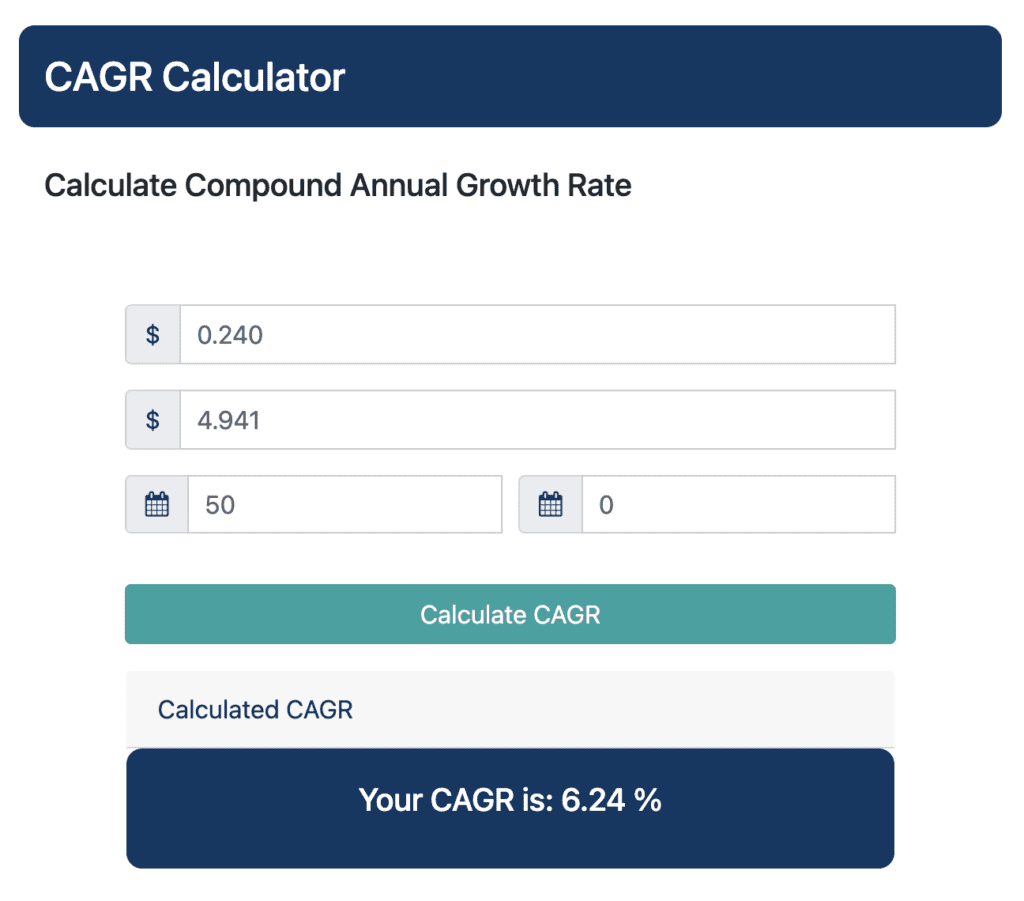
We observe the average historical GDP growth rate of Japan is 6.24% per year between 1971 and 2021.
4. Germany GDP CAGR: Historical Growth Rate of Germany’s GDP
- GDP in 1971: 0.250 Trillion USD
- GDP in 2021: 4.260 Trillion USD
- Years: 1971-2021 (50 years)
We can use the CAGR Calculator to determine the GDP CAGR of Germany for 50 years (1971-2021).
- Initial Value: 0.250
- Final Value: 4.260
- Time: 50
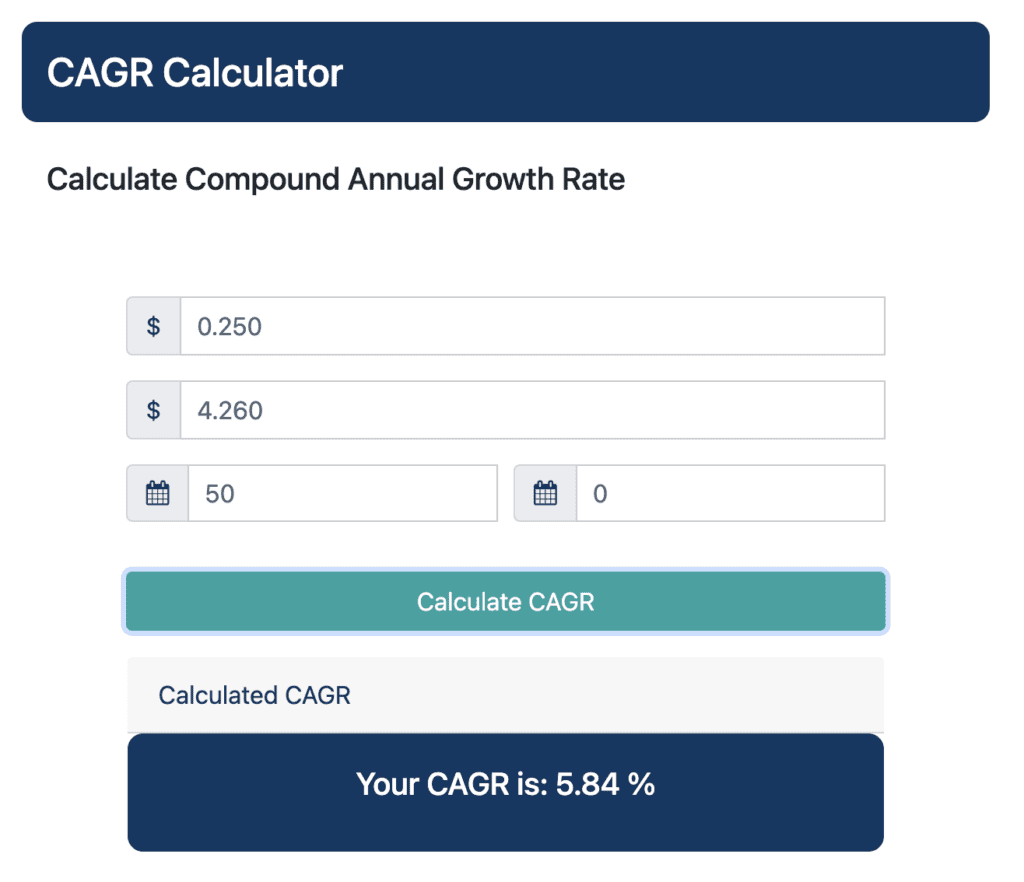
We observe the average historical GDP growth rate of Germany is 5.84% per year between 1971 and 2021.
5. India GDP CAGR: Historical Growth Rate of India’s GDP
- GDP in 1971: 0.067 Trillion USD
- GDP in 2021: 3.176 Trillion USD
- Years: 1971-2021 (50 years)
We can use the CAGR Calculator to determine the GDP CAGR of India for 50 years (1971-2021).
- Initial Value: 0.067
- Final Value: 3.176
- Time: 50
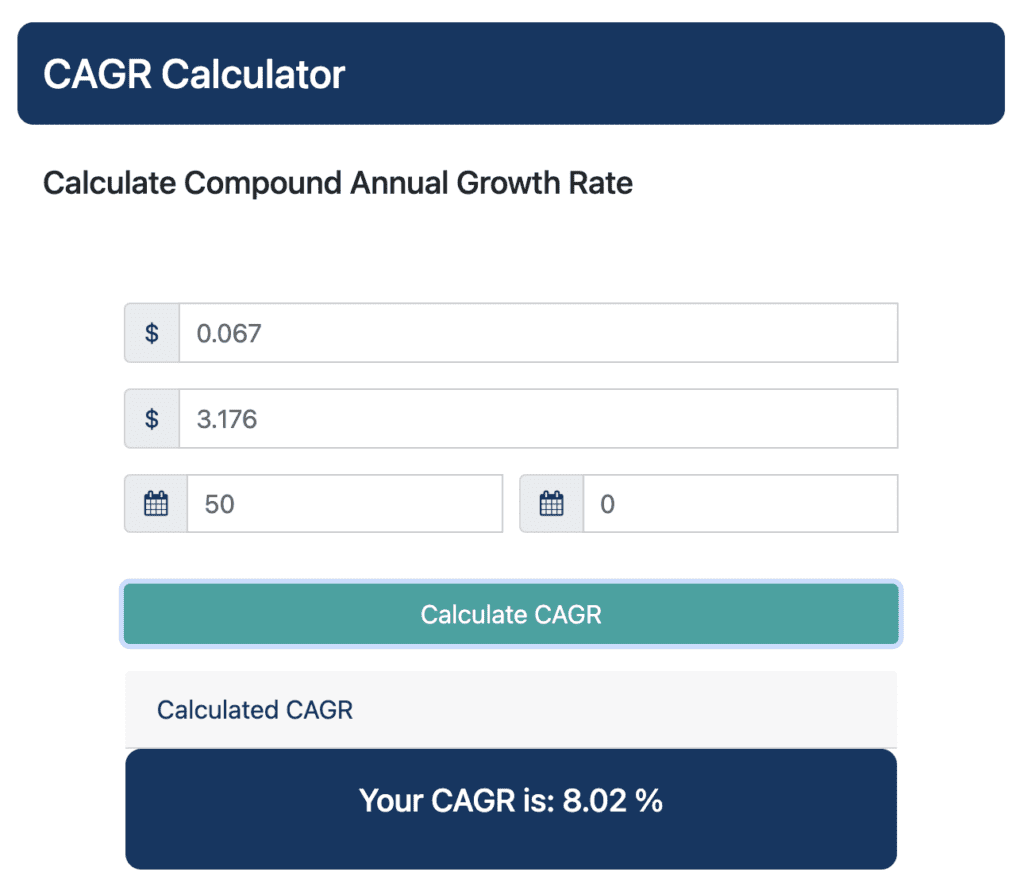
We observe the average historical GDP growth rate of India is 8.02% per year between 1971 and 2021.
6. UK GDP CAGR: Historical Growth Rate of UK’s GDP
- GDP in 1971: 0.148 Trillion USD
- GDP in 2021: 3.131 Trillion USD
- Years: 1971-2021 (50 years)
We can use the CAGR Calculator to determine the GDP CAGR of the UK for 50 years (1971-2021).
- Initial Value: 0.148
- Final Value: 3.131
- Time: 50
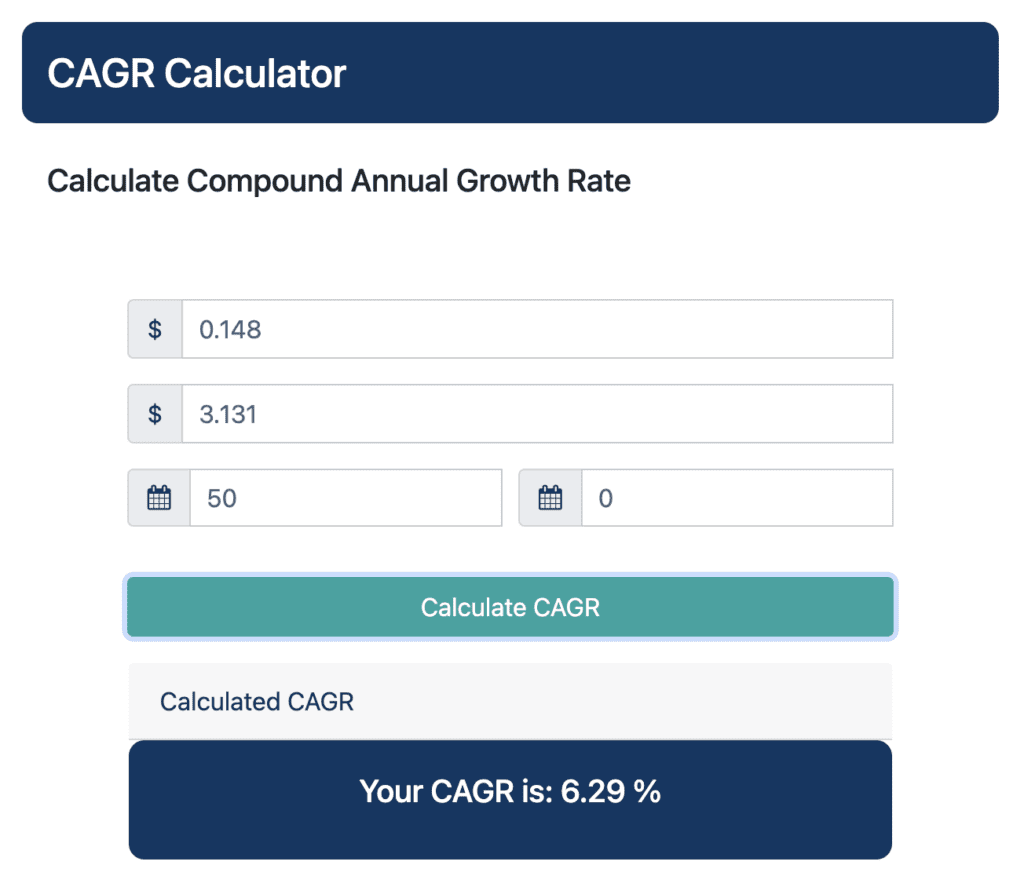
We observe the average historical GDP growth rate of the UK is 6.29% per year between 1971 and 2021.
50-Year GDP Growth Rates of Major Economies (1971-2021)
Based on our analysis, the average annual growth rates in GDP of the top economies in the analysis period (1971-2021) are the following:
- China: 10.91%
- India: 8.02%
- UK: 6.29%
- Japan: 6.24%
- USA: 6.18%
- Germany: 5.84%
These growth rates do not imply that every year these economies grew at exactly these rates, but rather grew on average at these rates during the 50-year period (1971-2021).
The rise of China and India from a very small GDP base (0.100 Trillion USD and 0.067 Trillion USD respectively) has shown the importance of consistently high growth rates year over year.
China with an average double-digit CAGR for the last 50 years has secured itself at the second spot, just behind the United States.
