Economists and investors often refer to stock market growth and talk about the S&P 500 CAGR.
But what is S&P 500?
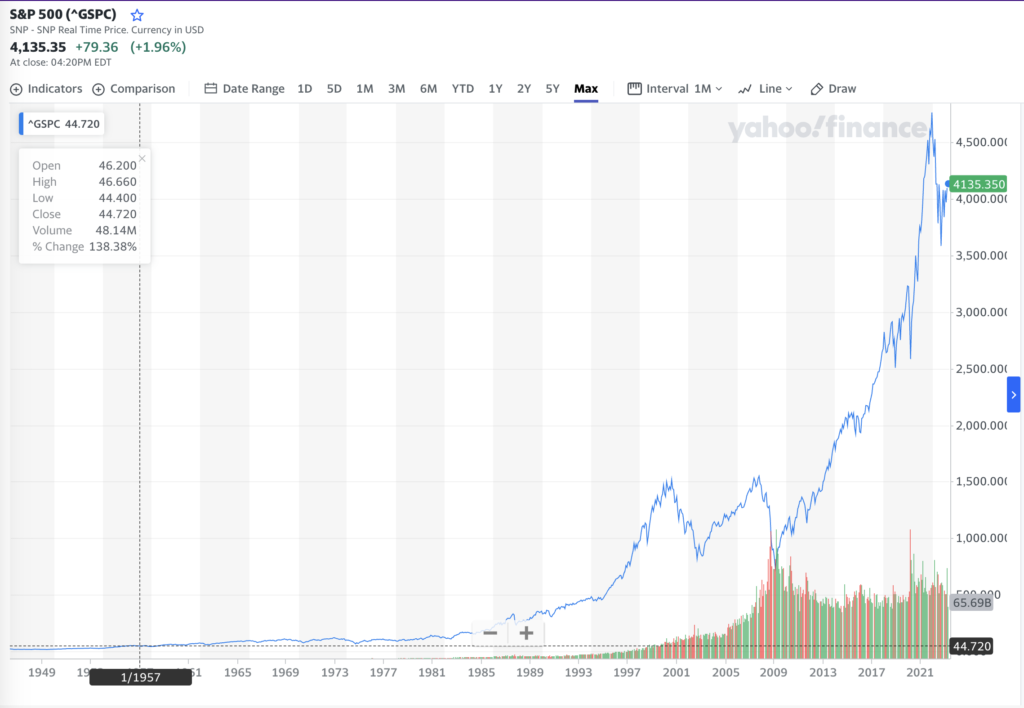
The S&P 500 Index is an index composed of the 500 largest companies that are listed on the stock market in the United States.
The stocks in the S&P 500 Index are weighted proportional to the market capitalization of the stocks.
The acronym “S&P” represents “Standard and Poor’s”, which originated from the amalgamation of Henry Poor’s annual book, which listed publicly held railroad companies, with the Standard Statistics Company’s publications in 1941.
The S&P 500 Index came into being in 1957. The “500” in the S&P 500 index refers to the number of stocks that are included in the index.
Some of the main stocks that constitute the S&P 500 Index are Apple (AAPL), Microsoft (MSFT), Alphabet(GOOG), Amazon (AMZN), Nvidia (NVDA), Exxon (XOM), etc.
The S&P 500 Index is maintained by the S&P Dow Jones Indices, a division of S&P Global.
S&P 500 Average Return For Last 10 Years: 10 Year S&P 500 CAGR
Let’s take a look at the compound annual growth rate of S&P 500 Index over a 10-year period. The period we are considering is April 2013 to April 2023.
In this period we observe that the Index grew from 1630 points to 4135 points, over a period of 10 years.
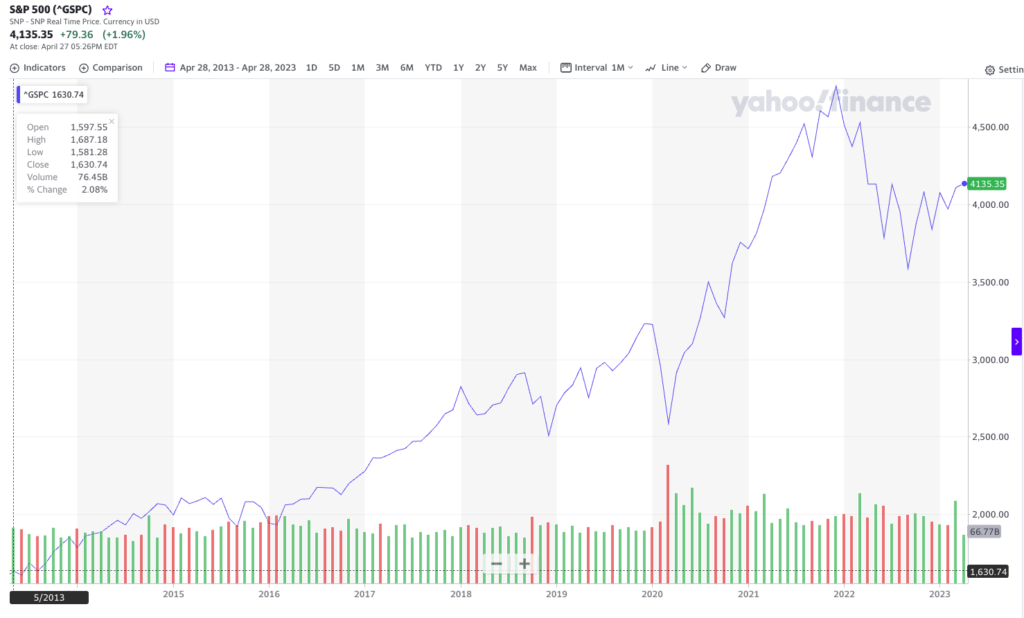
From 1630 in 2013 to 4135 in 2023
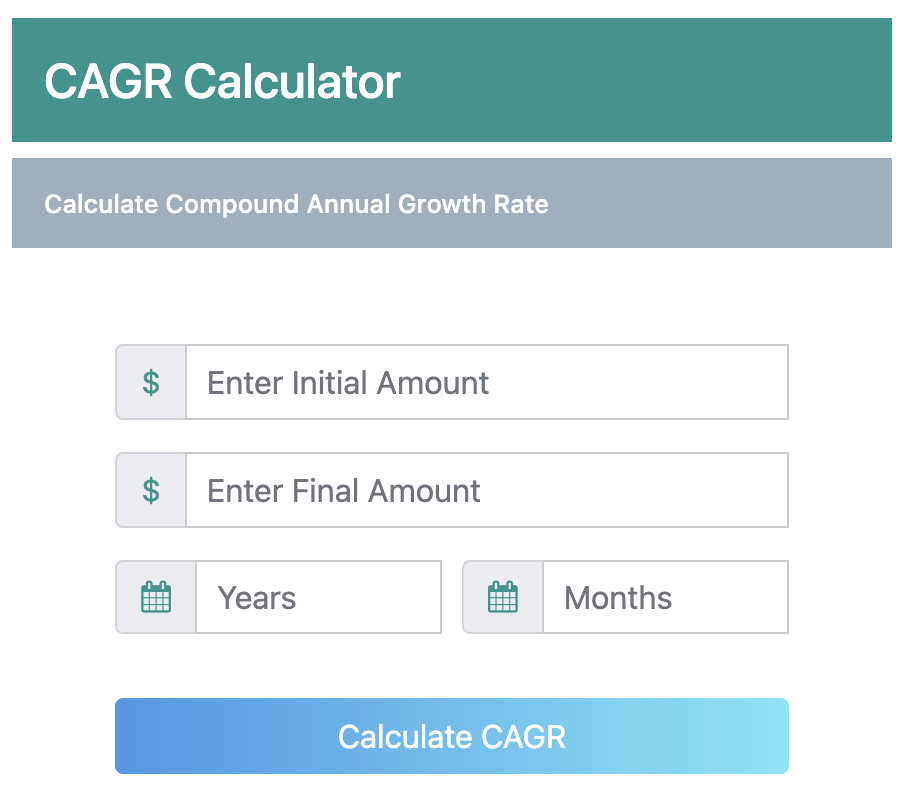
Let’s use our CAGR Calculator to calculate the S&P 500 CAGR for 10 years.
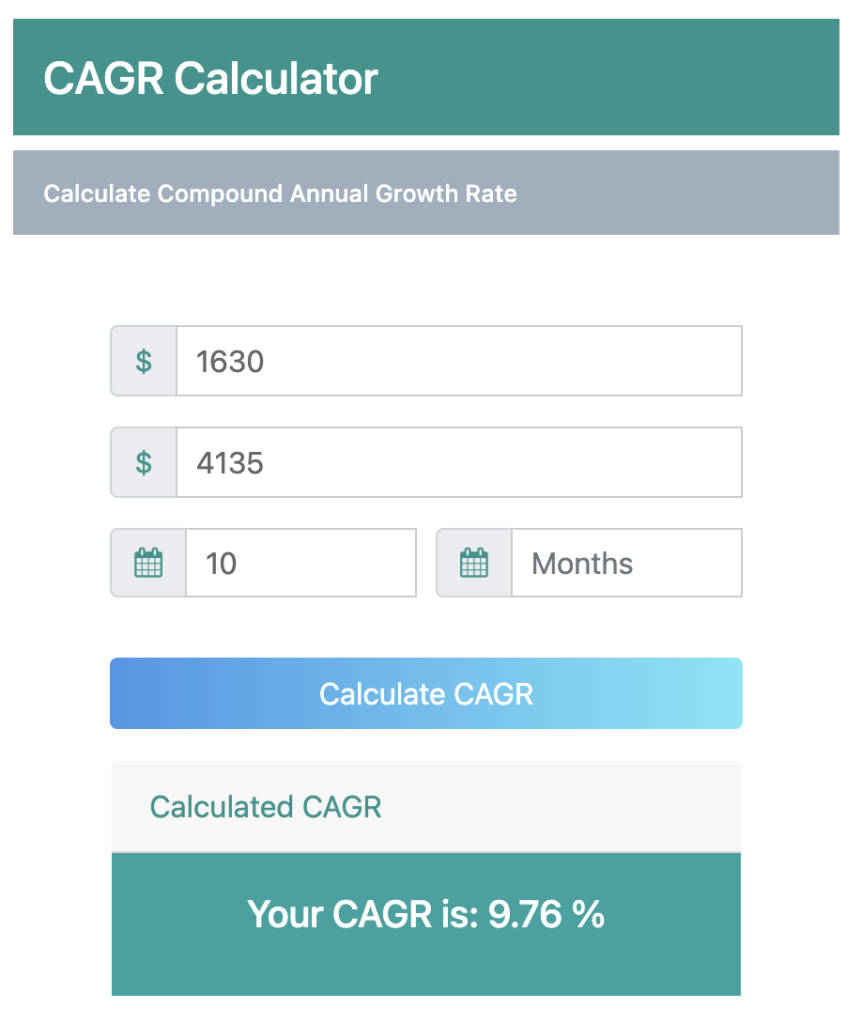
Putting in the values in the CAGR Calculator, we get the answer that the CAGR of S&P 500 Index was 9.76% between April 2013 and April 2023.
Read Also:
- Russell 2000 CAGR: The Compound Annual Growth Rate of Russell 2000 Index
- Stock Market CAGR Returns: Average Annual Stock Market Returns In Last 30 Years
- def CAGR: How To Calculate CAGR in Python By Defining 1 Easy Function
- Population CAGR: India vs China Population Growth Rate In Last 60 Years
- Dow Jones CAGR: The Compound Annual Growth Rate of Dow Jones Industrial Average
- S&P 500 CAGR: The Compound Annual Growth Rate of S&P 500 Index
- CAGR Formula in Excel: 2 Easy Methods To Calculate CAGR in Excel
- CAGR Formula in Google Sheets: 2 Easy Methods To Calculate CAGR in Google Sheets
S&P 500 Average Return For Last 20 Years: 20 Year S&P 500 CAGR
Let’s take a look at the compound annual growth rate of S&P 500 Index over a 20-year period. The period we are considering is April 2003 to April 2023.
In this period we observe that the Index grew from 917 points to 4135 points, over a period of 20 years.
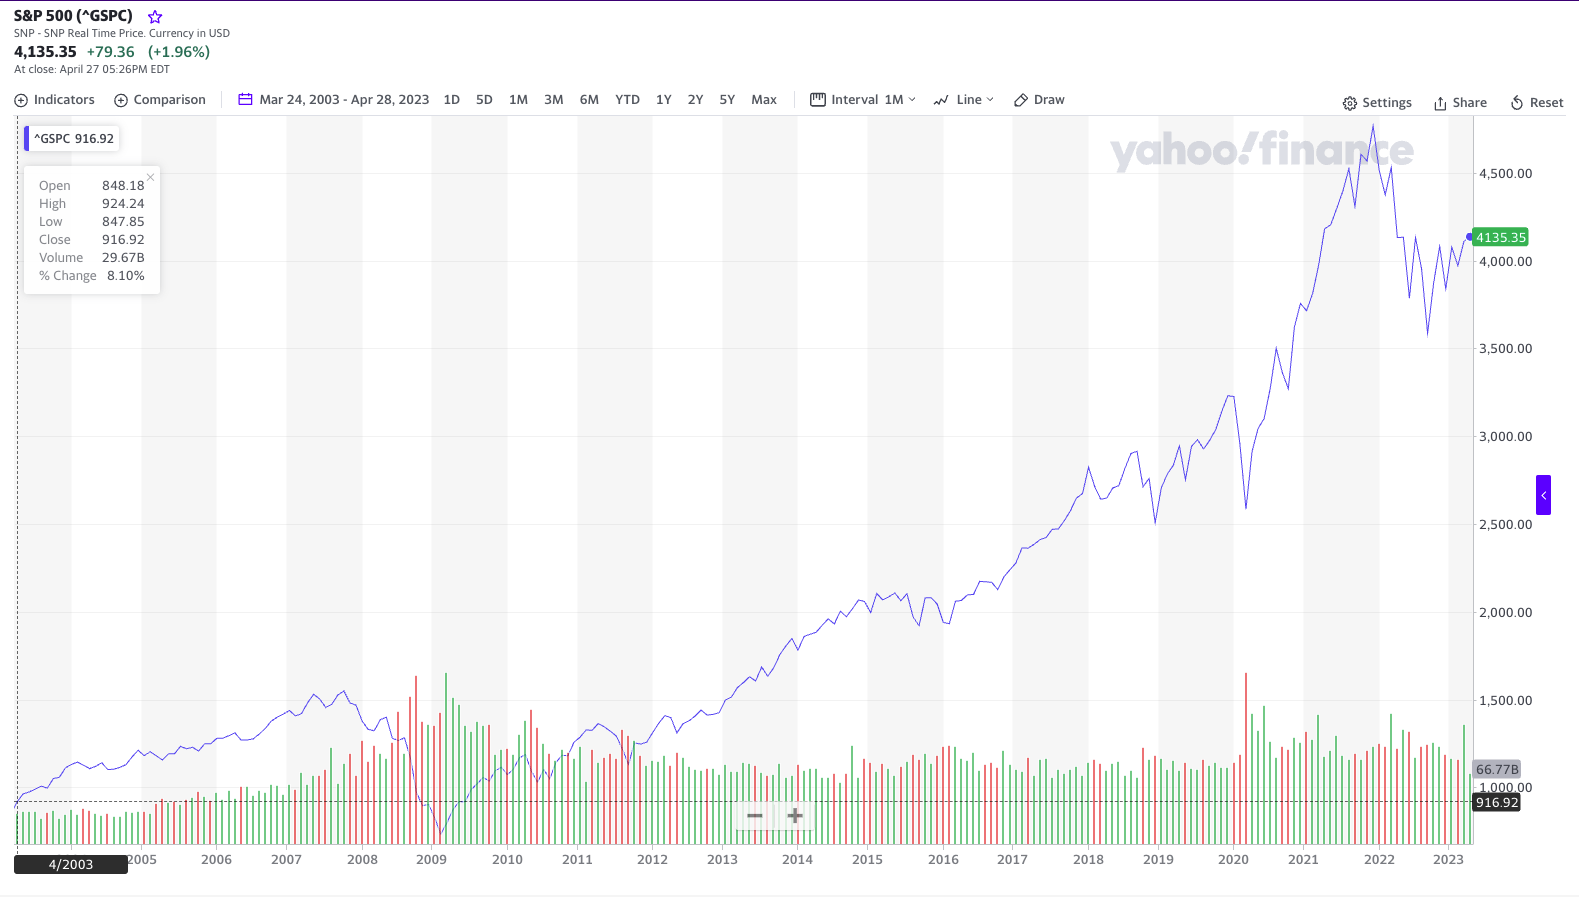
From 917 in 2003 to 4135 in 2023
Let’s use our CAGR Calculator to calculate the S&P 500 CAGR.
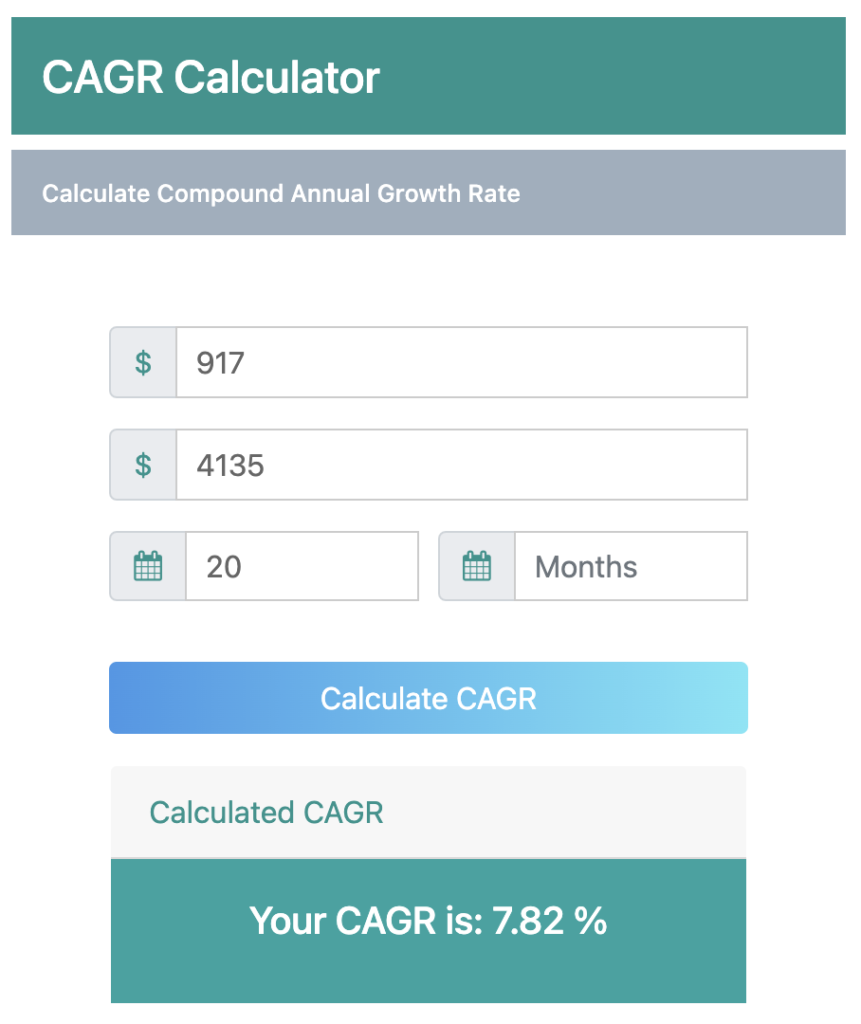
Putting in the values in the CAGR Calculator, we get the answer that the CAGR of S&P 500 Index was 7.82% between April 2003 and April 2023.
We have shown two examples here to calculate the S&P 500 CAGR, but there are an infinite amount of time periods for which you could compute the CAGR. So, let’s take a look at how you can calculate the S&P CAGR for any time period.
S&P 500 Average Return: How To Calculate S&P 500 CAGR?
Calculating the S&P 500 CAGR is easy, simply follow the steps below:
Step 1.
Go to Yahoo Finance or Google Finance and search for S&P 500 in the search bar.
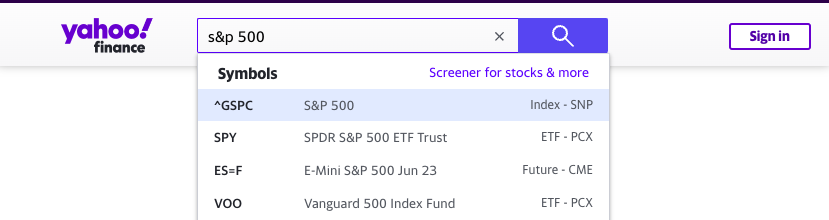
On Yahoo Finance, pick the first result, S&P 500, with the symbol ‘^GSPC’.
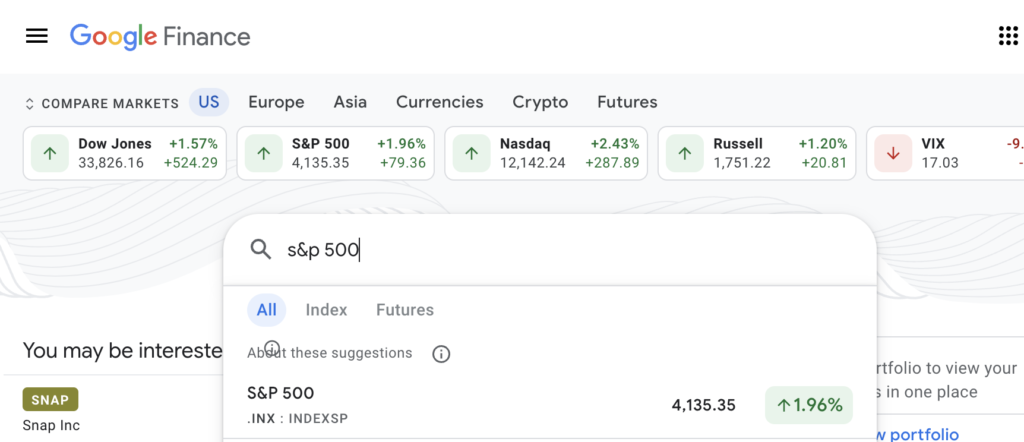
On Google Finance, pick the first result, S&P 500, with the symbol ‘.INX : INDEXSP’
Step 2.
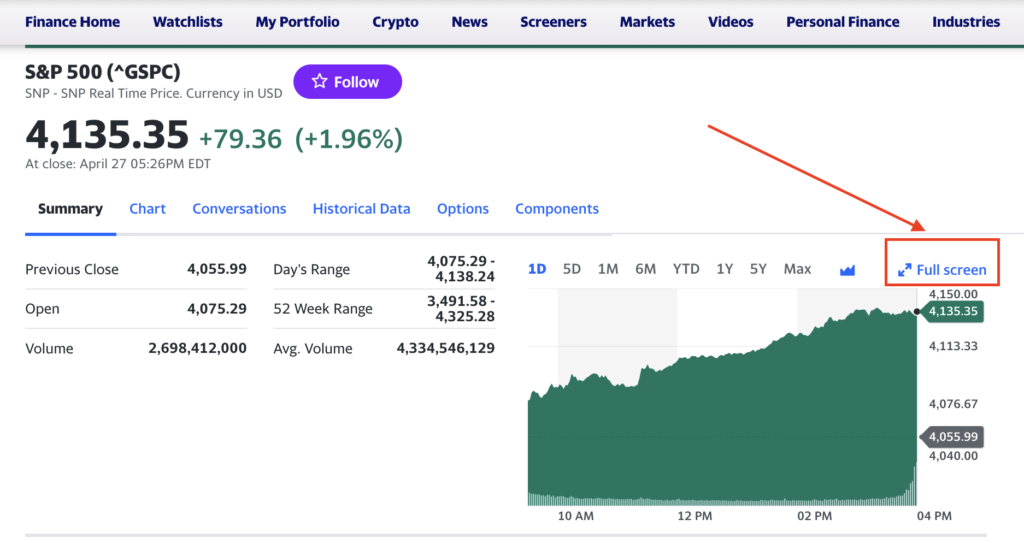
On Yahoo Finance make the chart fullscreen by clicking on the option above the chart.
In case of old-style Yahoo Finance charts, you will see a date range picker on top of the chart.
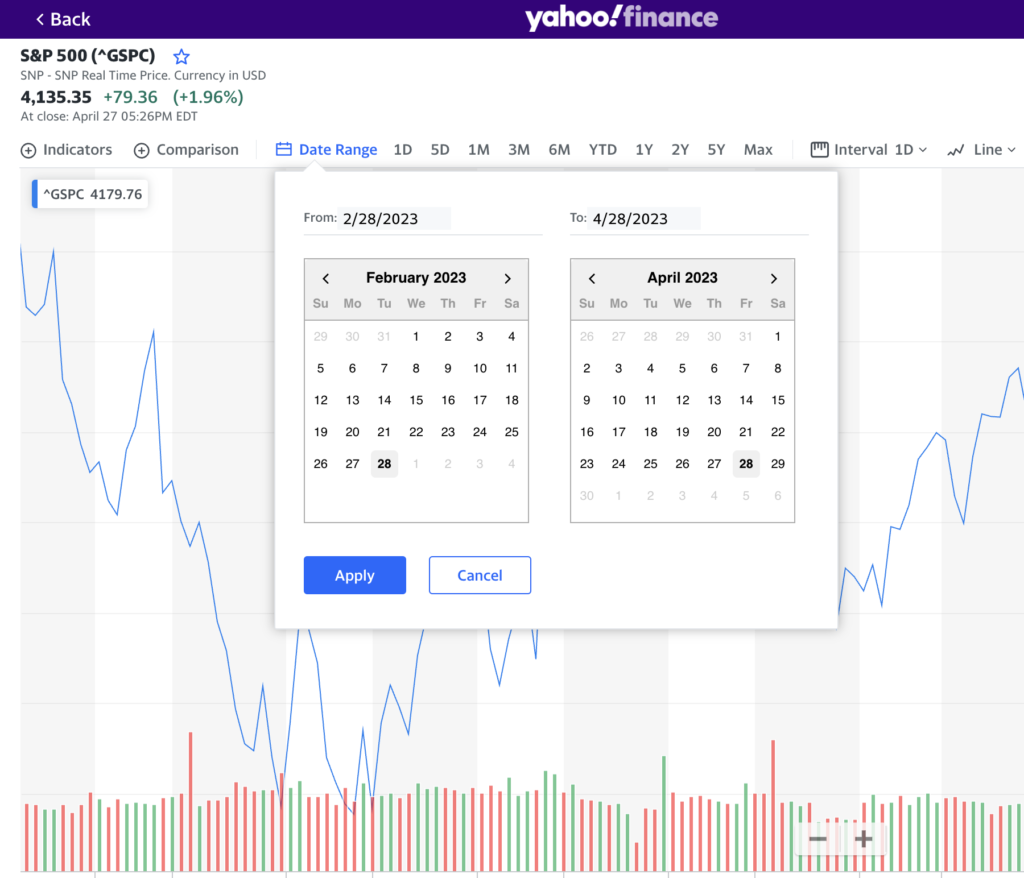
In case you get the new chart style, the date picker may be located at the bottom of the chart.
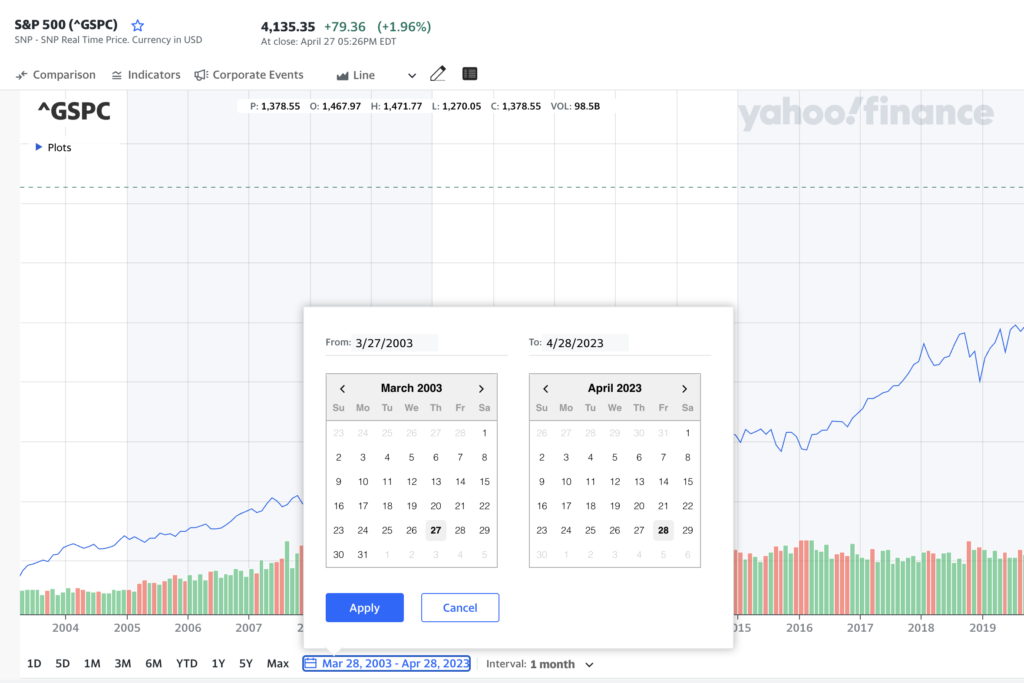
In either case, simply pick a date range you’d like.
Right next to it is the ‘Interval’. Pick the interval you’d like on your chart i.e. every data point on the chart should represent a day, week, month, etc.
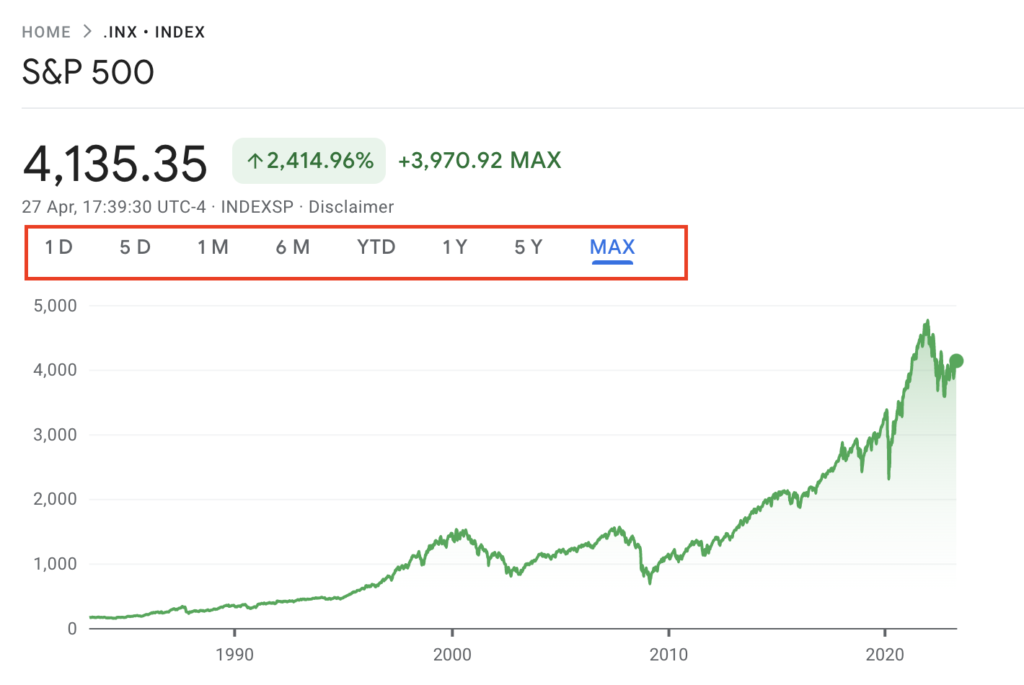
Google Finance doesn’t allow the users to specify a particular date range, other than the predefined ranges it has – 1 day, 5 days, 1 month, 6 months, Year To Date, 1 Year, 5 Years, and MAX (which goes back to a maximum of 30 years).
You can pick a date range and hover over the chart to note down the date and values on Google Finance and skip to Step 4.
However, since Yahoo Finance allows more flexibility, we tend to use it more often.
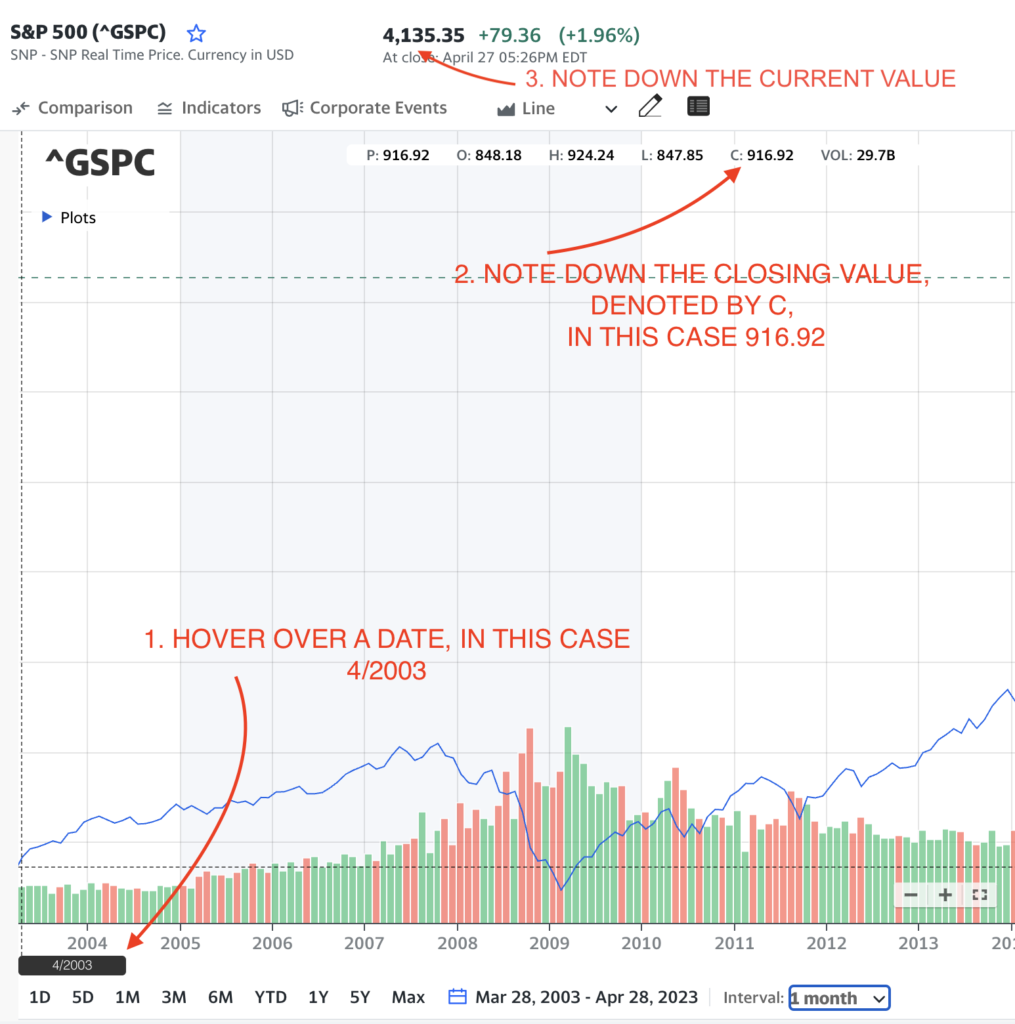
Step 3.
Once you have the chart adjusted for your date ranges, hover over the chart, note down the starting date, and the closing value.
You know the current date, the current value can be obtained by hovering over the chart or simply looking at the top section.
Step 4.
Now you have the starting value (917), ending value (4135), and the time period (20 years). Feed these values in the CAGR Calculator fields – initial amount, final amount, and years respectively. Hit Calculate CAGR, and you have your S&P 500 CAGR!
Is there an S&P 500 return calculator?
You can use the online CAGR Calculator as explained in this article to calculate the historical S&P 500 annual returns.
What is the S&P 500 average annual return?
The S&P 500 average annual return depends on the time period we want to observe. For example, as shown in this article, over the 20-year period from 2003 to 2023, we have seen an average annual return of 7.82%. But, during the 10-year period from 2013 to 2023, we have observed an annual average return of 9.76%

CAGR Calculator | Reverse CAGR Calculator | Blog Posts
Learn Personal Finance
Check out our new venture multipl !
More From The Blog


Our Financial Calculator Apps