Let’s understand how we can analyze the UK Stock Market CAGR Returns.
The United Kingdom (UK) is one of the leading economies of the world and has a big stock market for investors and traders. The UK stock market plays a significant role in the country’s economy and attracts both domestic and international investors.
The primary stock exchange in the UK is the London Stock Exchange (LSE), which is one of the largest and most prestigious stock exchanges in the world.
The main index of the UK stock market is the FTSE 100 Index, often referred to as the “Footsie.” It consists of the 100 largest companies listed on the LSE, based on market capitalization. The FTSE 100 serves as a benchmark for the overall performance of the UK stock market and is closely watched by investors and financial professionals.
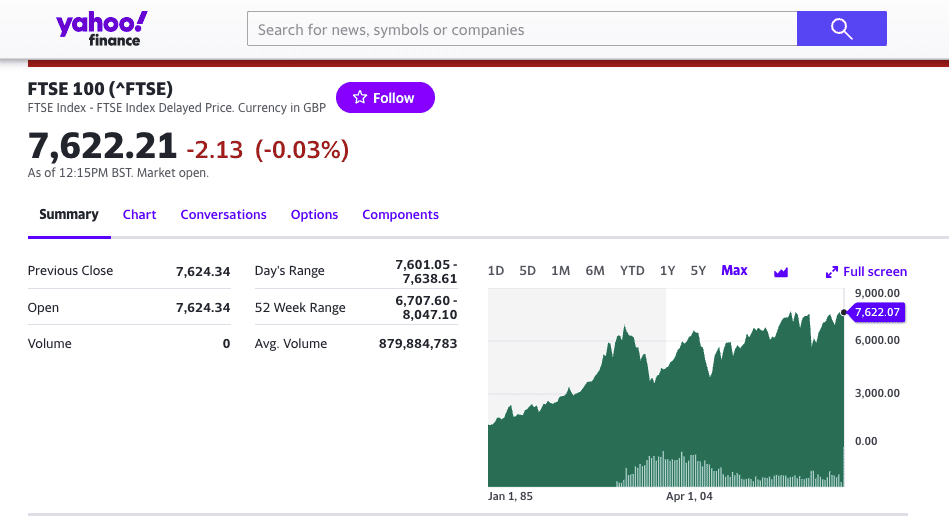
FTSE 100 Index on Yahoo Finance
Apart from the FTSE 100, there are other indices within the UK stock market, such as the FTSE 250, which includes the next 250 largest companies after the FTSE 100, and the FTSE All-Share, which represents the broadest measure of the UK stock market by encompassing companies of all sizes.
We will use the FTSE 100 to represent the UK stock market and evaluate its performance.
30 Year UK Stock Market CAGR Returns Measured Via FTSE 100
The FTSE 100 is an index composed of 100 large companies listed on the London Stock Exchange (LSE). The stocks in the FTSE 100 Index are weighted proportional to their market capitalization.
Some of the main stocks that constitute the FTSE 100 Index are ASTRAZENECA (AZN), SHELL (SHEL), HSBC HLDGS (HSBA), UNILEVER (ULVR), BP (BP), etc.
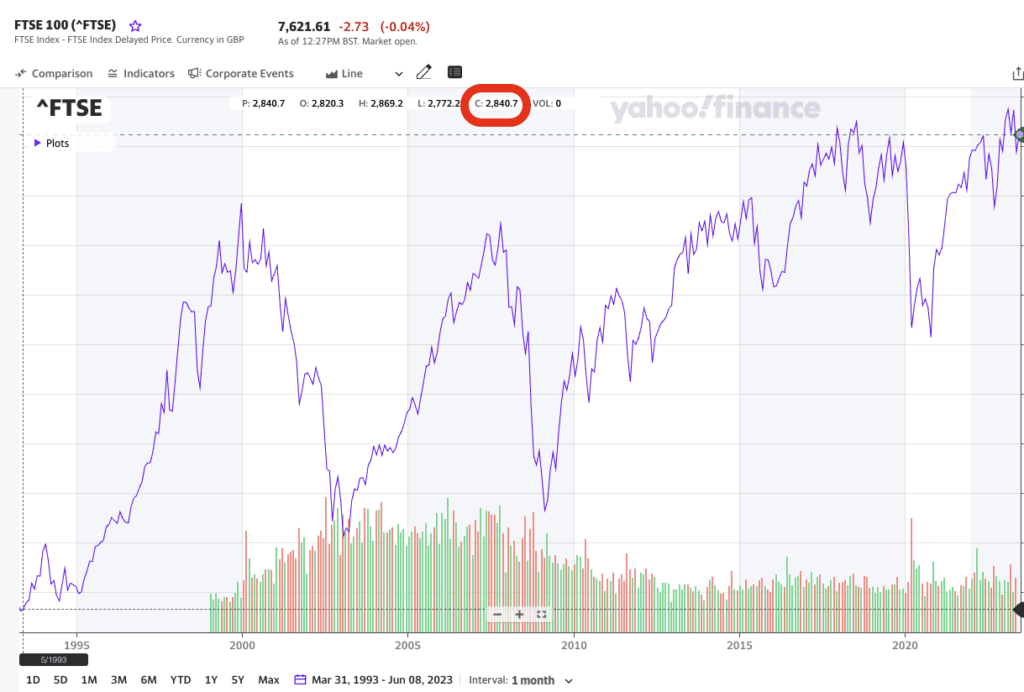
30 Year Stock Market Chart for FTSE 100 Index [May 1993 – May 2023]
30 Year FTSE 100 CAGR
From the stock price chart above, we note down the important data points:
- Start Point: May 1993
- End Point: May 2023 (June 8, actually)
- Time Period: 30 Years
- Value of FTSE 100 at Starting Point: 2840.7
- Value of FTSE 100 at Ending Point: 7621.67
Now, we can use the online CAGR Calculator to calculate the CAGR return of FTSE 100 for the last 30 years.
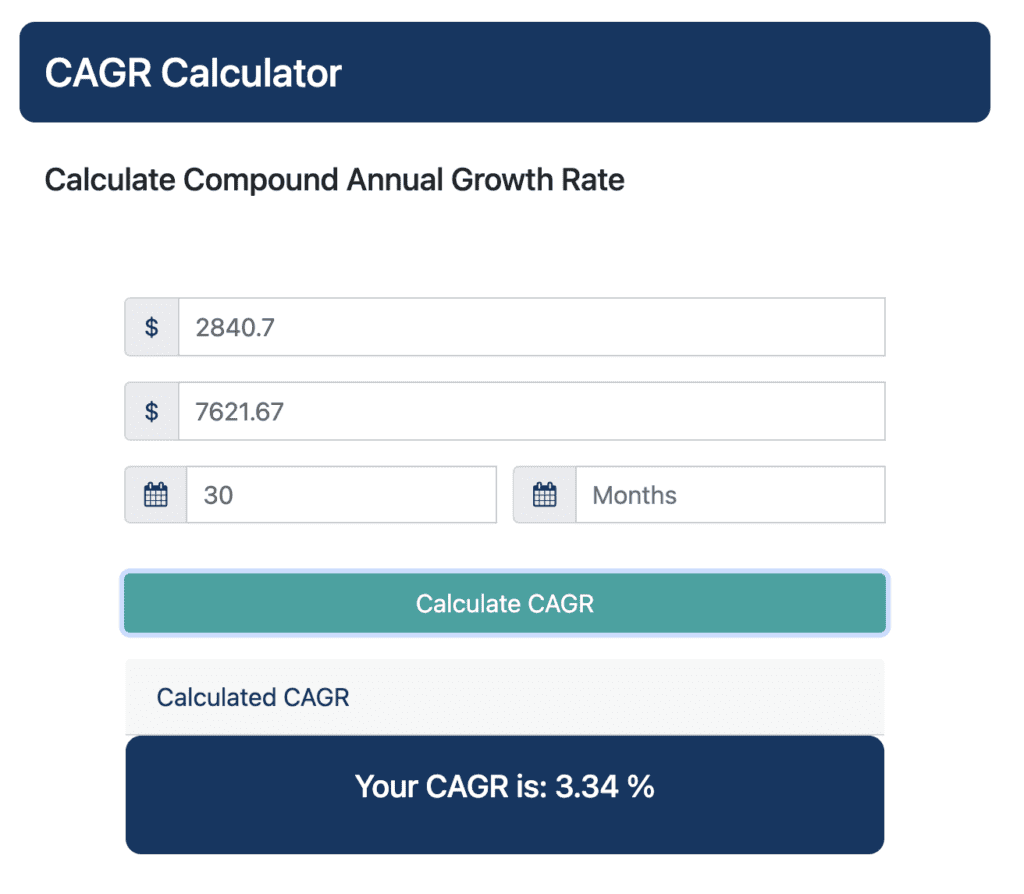
Based on our observation, the average annual FTSE 100 return measured in the last 30 years is 3.34% per year.
20 Year UK Stock Market CAGR Returns Measured Via FTSE 100
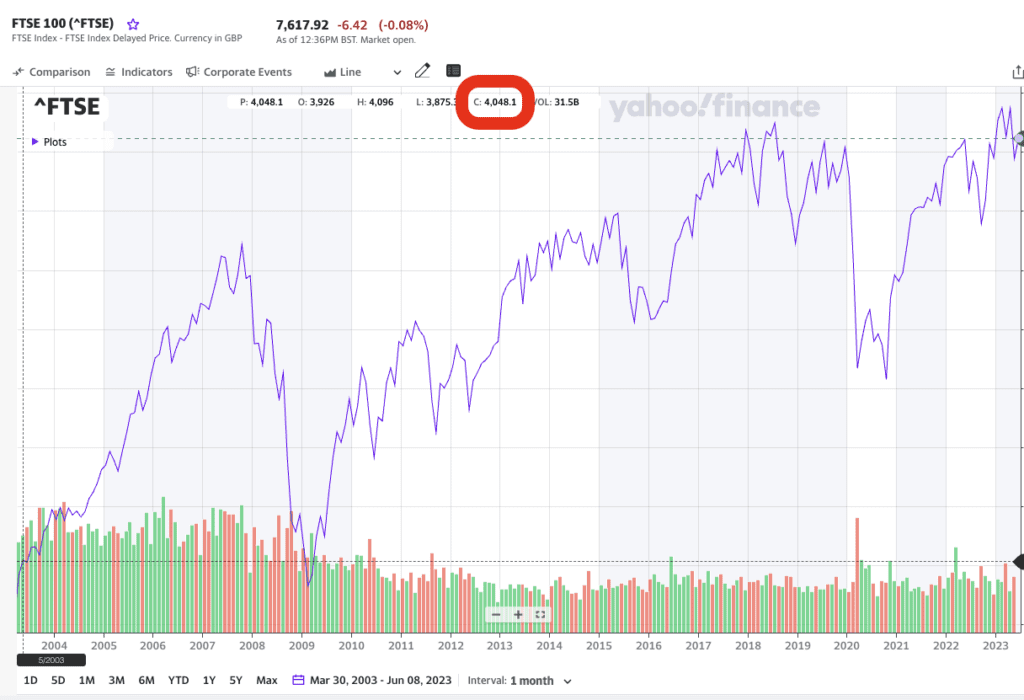
20 Year Stock Market Chart for FTSE 100 Index [May 2003 – May 2023]
20 Year FTSE 100 CAGR
From the stock price chart above, we note down the important data points:
- Start Point: May 2003
- End Point: May 2023 (June 8, actually)
- Time Period: 20 Years
- Value of FTSE 100 at Starting Point: 4048.1
- Value of FTSE 100 at Ending Point: 7617.92
Now, we can use the online CAGR Calculator to calculate the CAGR return of FTSE 100 for the last 20 years.
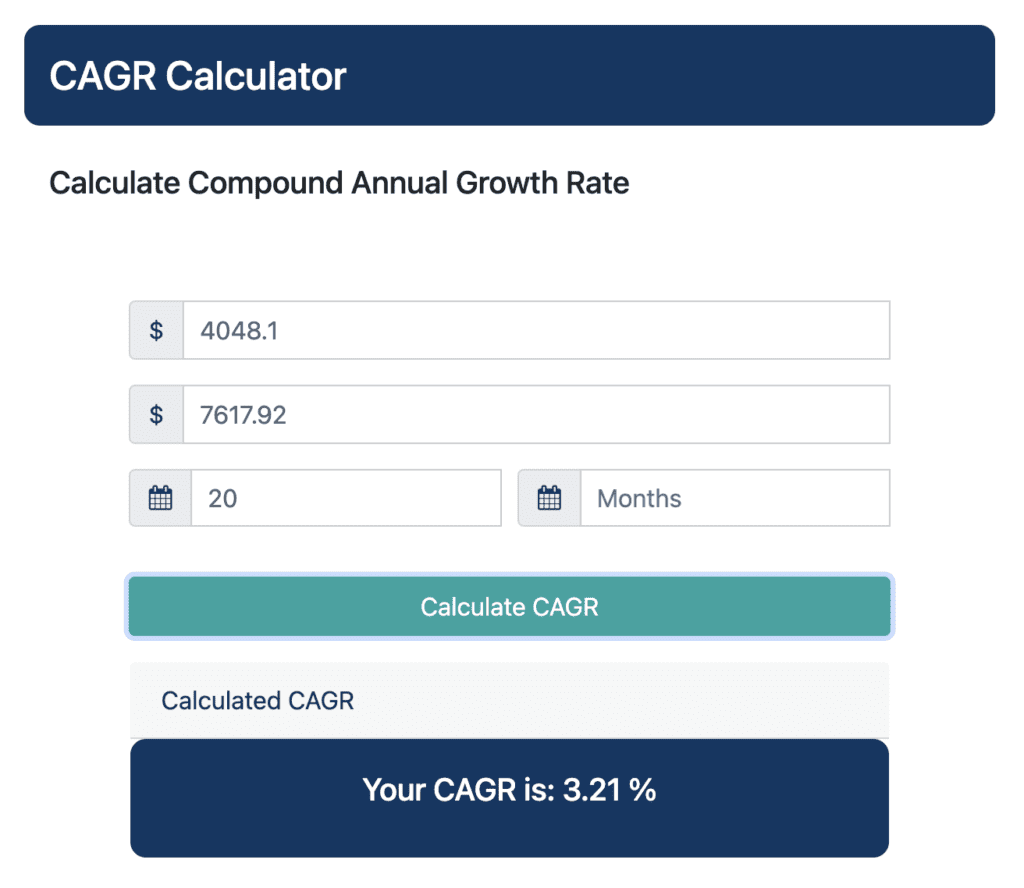
Based on our observation, the average annual FTSE 100 return measured in the last 20 years is 3.21% per year.
Read Also:
- Russell 2000 CAGR: The Compound Annual Growth Rate of Russell 2000 Index
- def CAGR: How To Calculate CAGR in Python By Defining 1 Easy Function
- Population CAGR: India vs China Population Growth Rate In Last 60 Years
- Dow Jones CAGR: The Compound Annual Growth Rate of Dow Jones Industrial Average
- S&P 500 CAGR: The Compound Annual Growth Rate of S&P 500 Index
- CAGR Formula in Excel: 2 Easy Methods To Calculate CAGR in Excel
- CAGR Formula in Google Sheets: 2 Easy Methods To Calculate CAGR in Google Sheets
10 Year UK Stock Market CAGR Returns Measured Via FTSE 100
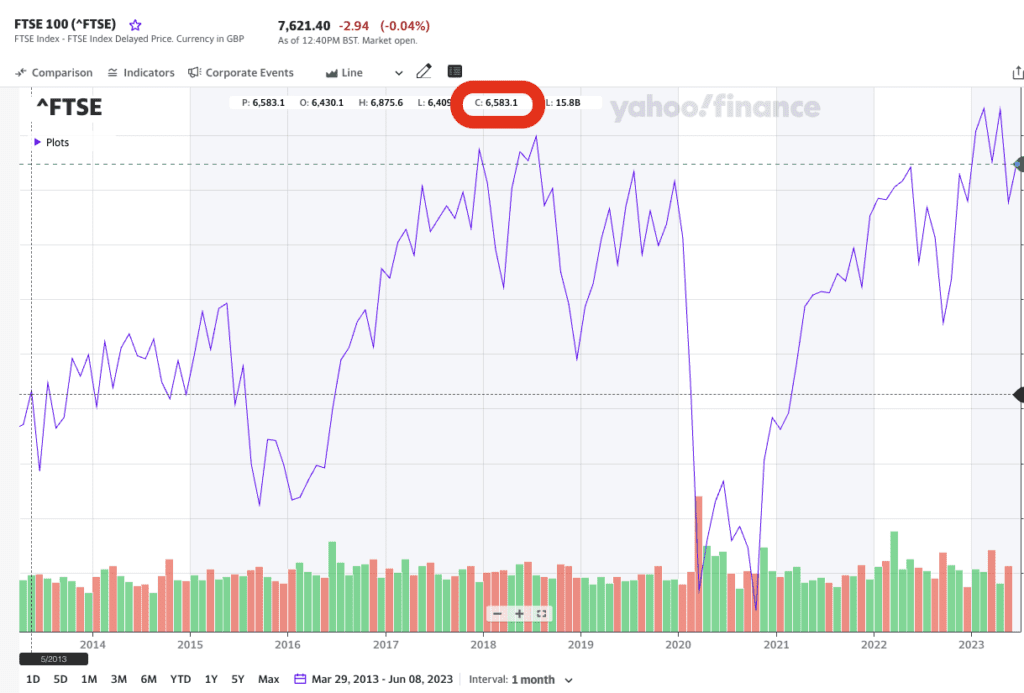
10 Year Stock Market Chart for FTSE 100 Index [May 2013 – May 2023]
10 Year FTSE 100 CAGR
From the stock price chart above, we note down the important data points:
- Start Point: May 2013
- End Point: May 2023 (June 8, actually)
- Time Period: 10 Years
- Value of FTSE 100 at Starting Point: 6583.1
- Value of FTSE 100 at Ending Point: 7621.40
Now, we can use the online CAGR Calculator to calculate the CAGR return of FTSE 100 for the last 10 years.
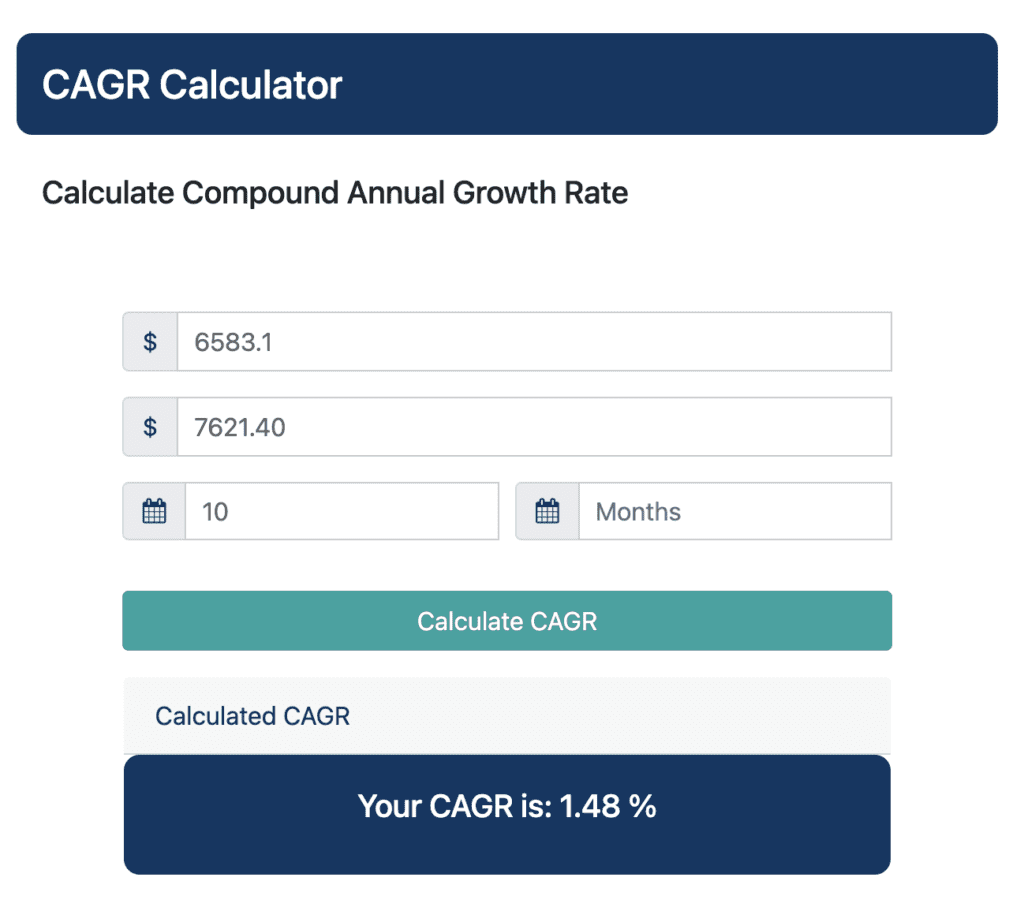
Based on our observation, the average annual FTSE 100 return measured in the last 10 years is 1.48% per year.
5 Year UK Stock Market CAGR Returns Measured Via FTSE 100
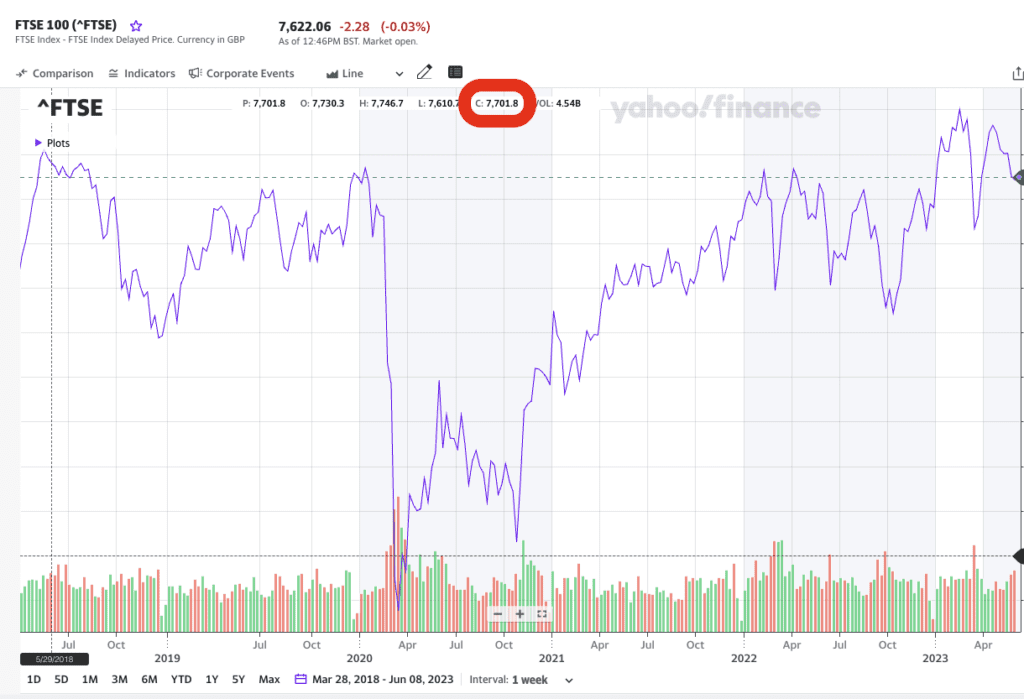
5 Year Stock Market Chart for FTSE 100 Index [May 2018 – May 2023]
5 Year FTSE 100 CAGR
From the stock price chart above, we note down the important data points:
- Start Point: May 2018
- End Point: May 2023 (June 8, actually)
- Time Period: 5 Years
- Value of FTSE 100 at Starting Point: 7701.8
- Value of FTSE 100 at Ending Point: 7622.06
Now, we can use the online CAGR Calculator to calculate the CAGR return of FTSE 100 for the last 10 years.
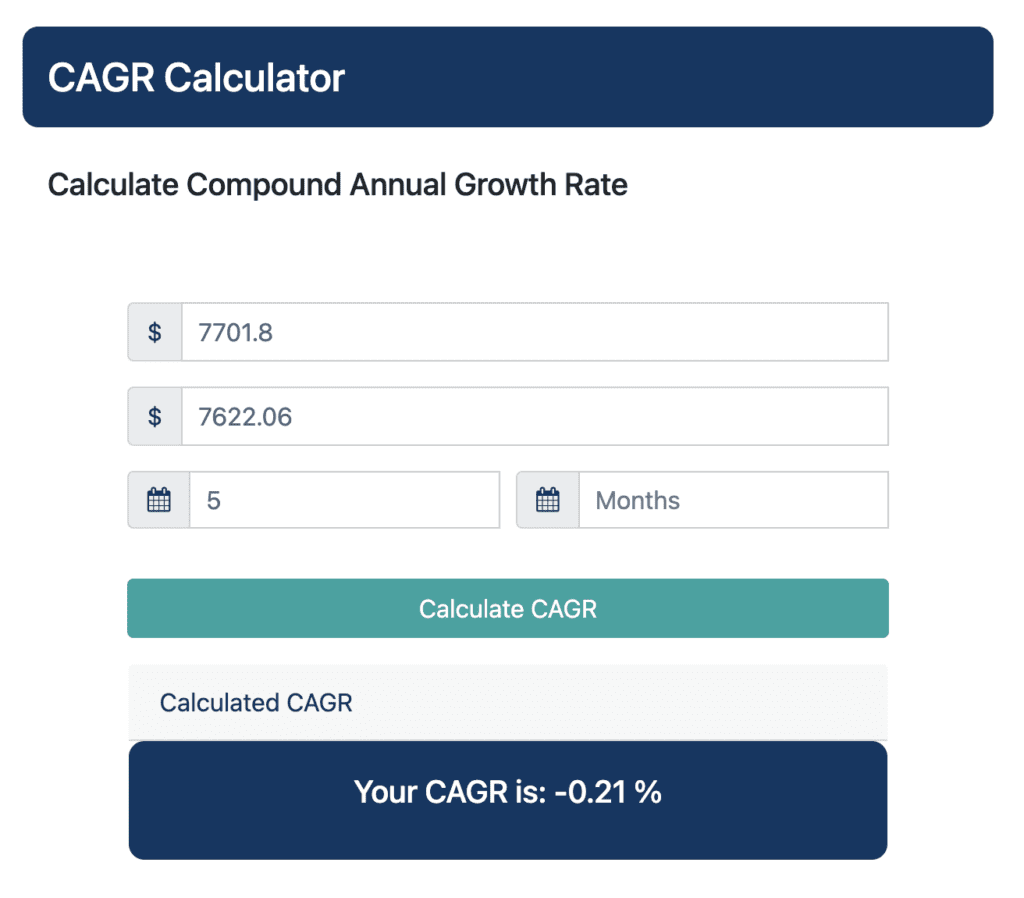
Based on our observation, the average annual FTSE 100 return measured in the last 5 years is -0.21% per year.
UK Stock Market CAGR: Summary
- 30 Year UK Stock Market CAGR: 3.34%
- 20 Year UK Stock Market CAGR: 3.21%
- 10 Year UK Stock Market CAGR: 1.48%
- 5 Year UK Stock Market CAGR: -0.21%
Based on our analysis, the UK stock market’s historical performance during the last 5, 10, 20, and 30 years has been very lacklustre and unattractive, especially compared to the US stock market.
Read about US Stock Market Returns:
- Stock Market CAGR Returns: Average Annual Stock Market Returns In Last 30 Years
- S&P 500 CAGR: The Compound Annual Growth Rate of S&P 500 Index
- Dow Jones CAGR: The Compound Annual Growth Rate of Dow Jones Industrial Average
CAGR Calculator | Reverse CAGR Calculator | Blog Posts
Learn Personal Finance
Check out our new venture multipl !
